| Group Selection | Detailed View |
|---|---|
 |
 |
| Moving Patterns | Reference Lines |
 |
|
Try it!
You can test TimeWidget right now with your own CSV data (less than 200MB), in TimeWidget: Test your own data
Or you can test it with the KMC weights data, in TimeWidget: KMC weights
Install
npm install time-widgetRequires ^popper.js@2.11.6, ^d3@7.8.2 and ^htl@0.3.1.
        <!DOCTYPE html>
<html lang="en">
<head>
    <meta charset="UTF-8" />
    <meta name="viewport" content="width=device-width, initial-scale=1.0" />
    <title>Document</title>
</head>
<body>
<!-- target for the main Widget -->
<h1>Stock Prices</h1>
<div id="target"></div>

<!-- Load the libraries -->
<!-- <script src="../dist/TimeWidget.js"></script> -->
<script src="https://d3js.org/d3.v7.js"></script>
<script src="https://unpkg.com/time-widget/dist/TimeWidget.min.js"></script>

<script>
    let data = [
        { Date: new Date("01/01/2023"), Open: 250, id: "Apple", group: "Technology" },
        { Date: new Date("01/02/2023"), Open: 240, id: "Apple", group: "Technology" },
        { Date: new Date("01/03/2023"), Open: 260, id: "Apple", group: "Technology" },
    ];

    let ts = TimeWidget(
        data,
        {
            x: "Date", // Attribute to show in the X axis (Note that it also supports functions)
            y: "Open", // Attribute to show in the Y axis (Note that it also supports functions)
            id: "stock", // Attribute to group the input data (Note that it also supports functions)
        }
    );

    ts.addEventListener("input", () => {
        console.log("Selected", ts.value);
    });

    document.getElementById("target").appendChild(ts);
</script>
</body>
</html>
Step by step
- HTML. Start with this template
<!DOCTYPE html> <html lang="en"> <head> <meta charset="UTF-8"> <meta name="viewport" content="width=device-width, initial-scale=1.0"> <title>Document</title> </head> <body> <!-- Your overview widget goes here --> <div id="target"></div> <!-- tYour detailed widget goes here --> <div id="targetDetailed"></div> </body> </html> - Import TimeWidget. Create and import a new JavaScript file below the scripts (d3, and
TimeWidget)
or right in the html like in the example below.
<script src="https://d3js.org/d3.v7.js"></script>
<script src="https://unpkg.com/time-widget/dist/TimeWidget.min.js"></script>
<script type="text/javascript">
  //   YOUR_JS_CODE_HERE
</script>
Create a TimeWidget Instance
let data = [ { Date: "01/01/2023", Open: 250, id: "Apple", group: "Technology" }, { Date: "01/02/2023", Open: 240, id: "Apple", group: "Technology" }, { Date: "01/03/2023", Open: 260, id: "Apple", group: "Technology" }, ]; let target = TimeWidget(data, { x: "Date", // Atribute to show in the X axis (Note that it also supports functions) y: "Open", // Atribute to show in the Y axis (Note that it also supports functions) id: "stock", // Atribute to group the input data (Note that it also supports functions) color: "Group", // (Optional) Attribute to color by }); target.addEventListener("input", () => {console.log("Selected", target.value.selectedIds)})- [Optional] Configure TimeWidget render
<
You have two options: add them at initialization:
let target = TimeWidget(data, {
x: "Date", // Atribute to show in the X axis (Note that it also supports functions)
y:  "Open", // Atribute to show in the Y axis (Note that it also supports functions)
id: "stock", // Atribute to group the input data (Note that it also supports functions)
color: "Group", // (Optional) Attribute to color by

xPartitions: , // Partitions performed on the X-axis for the collision acceleration algorithm.
yPartitions: 10, // Partitions performed on the Y-axis for the collision acceleration algorithm.
defaultAlpha: 0.8, // Default transparency (when no selection is active) of drawn lines
selectedAlpha: 1, // Transparency of selected lines
noSelectedAlpha: 0.4, // Transparency of unselected lines
backgroundColor: "#ffffff"
            });
Or as a subsequent step after initialization
// Default Parameters target.ts.xPartitions = 10; // Partitions performed on the X-axis for the collision acceleration algorithm. target.ts.yPartitions = 10; // Partitions performed on the Y-axis for the collision acceleration algorithm. target.ts.defaultAlpha = 0.8; // Default transparency (when no selection is active) of drawn lines target.ts.selectedAlpha = 1; // Transparency of selected lines target.ts.noSelectedAlpha = 0.4; // Transparency of unselected lines target.ts.backgroundColor = "#ffffff"; - **[Optional] Add the references lines
For the definition of the reference lines, see the custom formats sectiontarget.ts.addReferenceCurves(myReferenceCurves)
Options
This section will show all possible options grouped by categories.
Elements
- target: pass a html element where you want to render
- detailsElement: pass a html element where you want to render the details
- coordinatesElement: pass a html element where you want to render the brush coordinates Input.
- groupsElement: pass a html element where you want to have the brushes controls.
- showBrushesControls:If true, the brush control is displayed in the default location. If false you can still use brushesControlsElement to show the control on a different element on your app
- showBrushTooltip: Allows to display a tooltip on the brushes containing its coordinates.
Data
- x: Attribute to show in the X axis (Note that it also supports functions)
- y: Attribute to show in the Y axis (Note that it also supports functions)
- id: Attribute to group the input data (Note that it also supports functions)
- color: Specifies the attribute to be used to discriminate the groups (Note that it also supports functions).
- xScale: It allows to pass a scale of d3 with its parameters, except for the domain which is defined by the xDomain parameter.
- yScale: It allows to pass a scale of d3 with its parameters, except for the domain which is defined by the yDomain parameter.
- xDomain: Defines the domain to be used in the x scale.
- yDomain: Defines the domain to be used in the y scale.
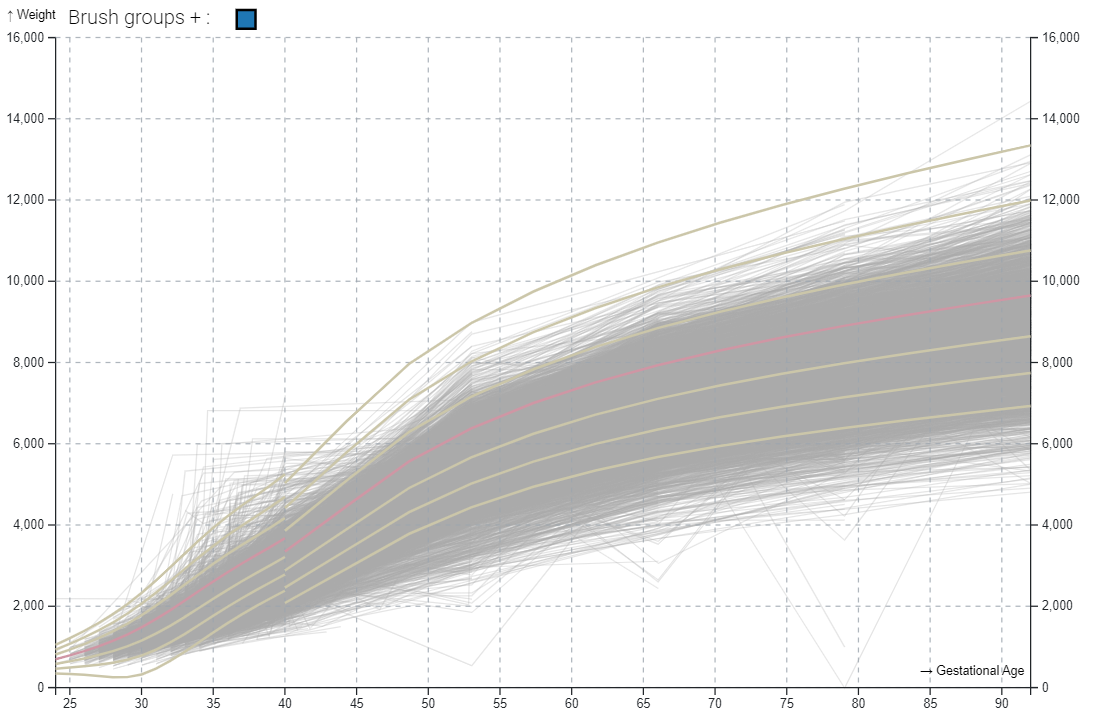
- referenceCurves: Specifies a Json object with the information of the reference lines.
- fmtX: Function, how to format x points in the tooltip. Note that it must conform to the data type provided in X.
- fmtY: Function, how to format x points in the tooltip. Note that it must conform to the data type provided in Y.
- xLabel: Label to show in the X axis
- yLabel: Label to show in the Y axis
- filters: Array of predefined TimeGroups and TimeBoxes.
Color Configuration
- defaultAlpha: Default transparency (when no selection is active) of drawn lines
- selectedAlpha: Transparency of selected lines
- noSelectedAlpha: Transparency of unselected lines
- alphaScale: A scale to adjust the alpha by the number of rendering elements
- backgroundColor:
- defaultColor: Default color (when no selection is active) of the drawn lines. It only has effect when "color" is not defined.
- selectedColor: Color of selected lines. It only has effect when "color" is not defined.
- noSelectedColor: Color of unselected lines. It only has effect when "color" is not defined.
- colorScale: The color scale to be used to display the different groups defined by the "color" attribute. Typically, a categorical scale of D3
- brushesColorScale: The color scale to be used to display the brushes typically a categorical scale of D3
- selectedColorTransform: Function to be applied to the color of the selected group. It only has effect when "color" is defined.
size Configuration
- width: Set the desired width of the overview Widget
- height: Set the desired height of the overview Widget
- detailsContainerHeight: Set the desired height of the details container Widget
- detailsWidth: Set the desired width of the individual details visualization
- detailsHeight: Set the desired height of the individual details visualization
- margin: Set the desired margin for overview Widget, d3 common format (
{ left: 50,
            top: 30, bottom: 50, right: 20 }
) - detailsMargin: Margin options for details view, d3 common format, leave null for using the overview margin
CallBacks
- updateCallback: (data) => doSomethingWithData
- statusCallback: (status) => doSomethingWithStatus
Rendering
- brushShadow: Determines how the shadow will be applied to the TimeBoxes belonging to the active TimeGroup.
- showGroupMedian: If active show a line with the median of the enabled groups.
- hasDetails: Determines whether detail data will be displayed or not. Disabling it saves preprocessing time if detail data is not to be displayed.
- doubleYlegend: Allows the y-axis legend to be displayed on both sides of the chart.
- showGrid: If active, a reference grid is displayed.
- brushGroupSize: Controls the size of the colored rectangles used to select the different brushGroups.
Performance
- maxDetailsRecords: How many results to show in the detail view
- maxTimelines: Set to a value to limit the number of distinct timelines to show
- xPartitions: Partitions performed on the X-axis for the collision acceleration algorithm.
- yPartitions: Partitions performed on the Y-axis for the collision acceleration algorithm.
Options
- medianNumBins: Number of bins used to compute the group median.
- medianLineDash: Selected group median line dash pattern canvas style
- medianLineAlpha: Selected group median line opacity
- medianLineWidth: Selected group median line width
- medianFn: Function to use when showing the median
- medianMinRecordsPerBin: Min number of records each bin must have to be considered
- autoUpdate: Allows to decide whether changes in brushes are processed while moving, or only at the end of the movement.
- _this: pass the object this in order to be able to maintain the state in case of changes in the input
- fixAxis: When active, the axes will not change when modifying the data.
Custom Formats
This section details the different formats used by the application for some parameters. Note that the fields marked as optional are not mandatory and if not provided a default value will be used.
Reference lines
[
  {
    "name": "Line1",
    "color": "yellow", // Color in css format
    "opacity": 1, // opacity level of the line
    "data": [[p1x,p1y],[p2x,p2y],...]
  },
  {
    "name": "Line2",
    "color": "red", // Color in css format
    "opacity": 0.5, // opacity level of the line
    "data": [[p1x,p1y],[p2x,p2y],...]
  }
]
Filters
 filters: [
    {
        name: "Group 1",
        IsEnable: true, /*Optional*/
        isActive: false, /*Optional*/
        brushes: [
            {
                selectionDomain: [
                  [1.5,-7], /*[x0,y0]*/
                  [2.5, -17] /*[x1,y1]*/
                ],
                mode: "intersect", /* or "contains". Optional*/
                aggregation: "and", /* or "or". Optional */
            }
        ]
    },
    {
        Another BrushGroup
    }
]
Source Code
The widget code is available here
To compile the code you should follow the instructions:
Go to the package download location
cd /{{Route]]/timewidget
Install the project
npm install
At this point you should have the project compiled in the folder dist, with the files
- TimeWidget.esm.js
- TimeWidget.js
- TimeWidget.min.js
License
TimeWidget.js is licensed under the MIT license. (http://opensource.org/licenses/MIT)e
Why this page?
This page has been created to maintain anonymity in the process of submitting a short-paper to ieeevis. This documentation is also available in the code repository on github (which we do not link to maintain anonymity) and on the NPM page.